CS40: Assignment #1: Image Manipulations & Fractals Paul Azunre
|
||
Description: In the first part of this assignment, the blue background of an image was removed using a statistical approach. Improvement to the statistical approach was attempted by implementing color mixing and feathering. In the second part, Mandelbrot and Julia sets were generated via iteration. Finally, the two portions of the assignment were linked in watermarking an image from the first part with a fractal generated in the second. Part 1: Removing the Blue Background A picture of the subject (the author of this report, Paul) was taken in front of a blue screen. The blue portions of this picture were removed by analyzing the RGB color space of each pixel. This space consists of three color fields: red, green and blue. With 8 bits per pixel representing each color, every field can take any value between 0 and 255. The proportion of blue in any pixel may be calculated as Pb = B/(B+R+G) (where B, R and G are the values of the blue, red and green color fields respectively). By statistically analyzing a portion of the blue background (i.e. by determining the mean and standard deviation of blue proportion in the background) and comparing it with the picture of the subject, it is possible to threshold out most of the blue background. Removing the blue background involves deciding how many standard deviations below/above the mean represent a suitable threshold and replacing all pixels that exceed this threshold with a new background. Part 2: Julia and Mandelbrot Sets Some dynamic systems tend towards certain stable states and may switch between them drastically. Such systems are called attractors and are of great interest in chaos theory. A simple attractor, proposed by Beniot Mandelbrot, may be expressed as:
[where c = 0.7454054 + i*0.1130063 for the purposes of the Julia set in this assignment)] The Julia set of a particular attractor is the set of starting points in the complex plane whose long term behavior tends to infinity. This can be generated by iterating the equation representing a particular attractor with different starting points and observing whether a certain threshold is exceeded within a maximum number of iterations. A set of "connected" Julia sets (i.e. the attractor basins are connected) is called a Mandelbrot set. This can be generated by observing whether the starting point (0,0) exceeds a fixed threshold within a maximum number of iterations for diferent values of c. In this assignment, the coloring schemes for the Julia and Mandelbrot sets were generated by taking the answers to the following questions into account:
Questions: 1. How big is the picture of yourself (pixel width and height)? How did you determine this? The picture analized in this assignment was 409 pixels wide by 567 pixel high. This was determined by opening and analyzing the picture in GIMP. 2. Where is the origin of an image--pixel (0, 0)--when you manipulate it in your code? How did you determine this? The origin of the image is located at the top left corner of the image for images in the .ppm format. This was determined by reading in the image, filling in a block from (0,0) to (10,10) with white [(R,G,B)=(255,255,255)], writing the image out and observing the location of the white block in the resulting image with GIMP. This method was suggested by Professor Bruce Maxwell in this assignment's guidelines. .TIFF images could not be analized due to the unavailability of necessary libraries on the Engineering Linux machines. 3. Where is the origin of an image in xv? How did you determine this? Is it consistent with pixel (0, 0) as tested above? The image was not viewed in xv due to its unvailability on the Engineering Linux machines. Instead, the image was viewed in GIMP and it was observed that the origin of the image is located at the top left corner, which is consistent with pixel (0,0) as tested above . 4. How did you replace the blue pixels in your picture? How well did your replacement method work?
The pixels were replaced using a method based on the mean and standard deviation of blue color proportions present in the background. A portion of the background was selected from the original image using GIMP and saved as a separate .ppm file. The main program, rpbkg.c, read in this image at the beginning of its run and calculated the proportion of blue color present in each pixel as Pb = B/(B+R+G) (where B, R and G are the values of the blue, green and red RGB color fields respectively). The mean and standard deviation of these proportions were calculated and used as a basis for replacing blue pixels. Any pixel in the original image that was found to have a Pb greater than 5.5 standard deviations below the mean, was regarded as blue and thus replaced with a corresponding pixel from the new background. The number 5.5 was arrived at by trial and error. The replacement method described above worked pretty well in replacing the blue background (See Fig 2 ). However, visible irregularities in color were observed at the edges of the subject (Paul). Also, some (barely noticeable) "blue-spill" occurred in the right eye of the subject. Some of this error was attributed to the brightness (or lack thereof) of the environment where the picture was taken. In order to improve the efficiency of the replacement method (without changing the approach itself), it may be necessary to retake the picture of the subject in better (brighter) conditions. Availability of a picture of the entire background (without the subject standing in front of it) could have helped as it would have provided a larger sample size for determining mean and standard deviation. As a modification to the statistical approach, "Feathering" (mixing colors at the edges of the subject) was attempted as an extension, and will be discussed later in this report.
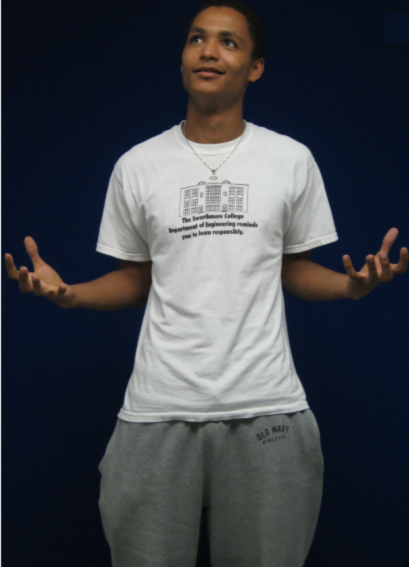
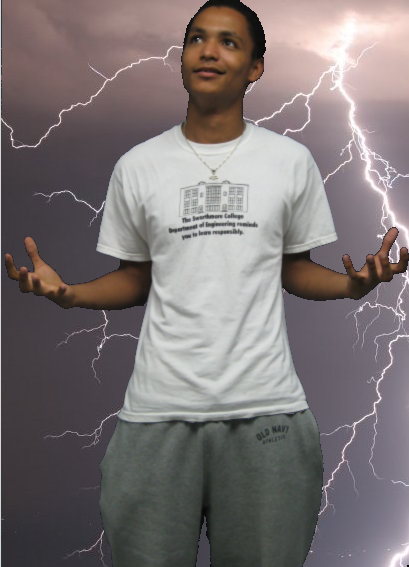
Figure 1. Original picture of Paul (with blue background).
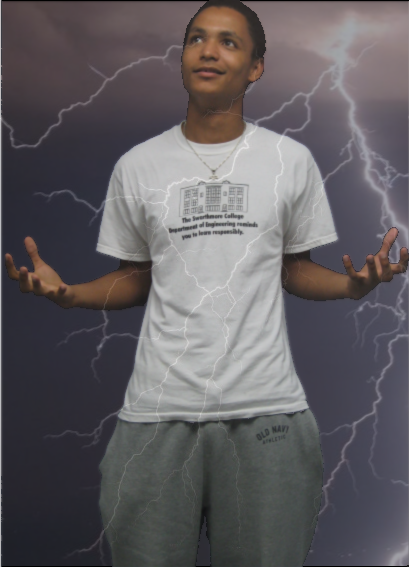
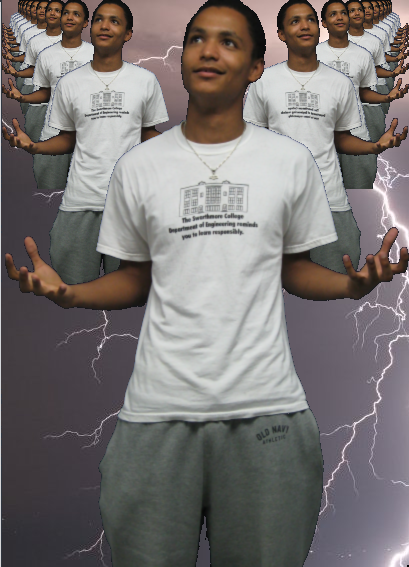
Figure 2. Paul with a novel background inserted via the standard deviation method 5. How did you creatively insert yourself in an image? For this question, write down the equations you used. Nineteen versions of the subject were creatively inserted into an image (see Fig 3 below). Versions of the subject were made to progressively diminish in size towards the top left and top right corners of the image, as if disappearing into the distance. Each (except the actual size) version of the subject has a mirror image around the center column. The equations used to create these effects are as follows: Let x, y, xn, yn and n represent original column number, original row number, new column number, new row number and the scaling factor respectively.
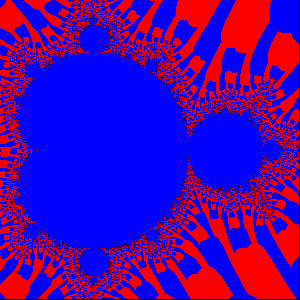
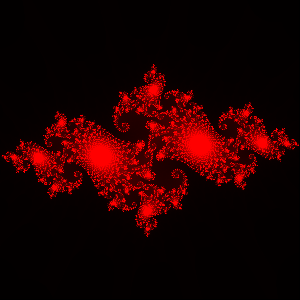
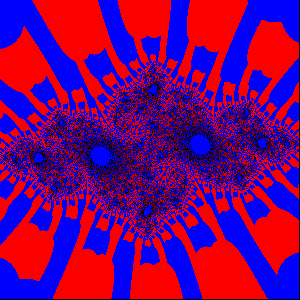
Figure 3. Paul with a novel background and several versions of himself creatively inserted. 6. What part of the Mandelbrot set did you find the most interesting? The edges of the Mandelbrot set were the most interesting parts. Both the inside and the outside of the set have little variation. At the edges, however, there is a drastic change in behavior which results in a more interesting picture. 7. What coloring schemes did you experiment with, and which did you like the best? Initially, both the Julia and the Mandelbrot sets were colored with a single color, with each point colored with an intensity based on the number of iterations it took that point to reach the specified threshold (see Fig 4 for a monochromatic version of the Julia set). This coloring scheme was found to be somewhat uninteresting and was thus abandoned. Next, each point was colored with either red, green or blue based on the remainder when the iteration number was divided by 3. This coloring scheme was more interesting, but the stark contrast between the three colors resulted in a picture with low aesthetic value. As a result, a coloring scheme that colored points as some shade of red and blue based on whether iteration number was even or odd was settled on (See Fig 6 for the entire Mandelbrot set and Fig 5 for the final Julia set)
Figure 7. The entire Mandelbrot set [in the rectangle defined by points (-0.5,1) and (1.5,-1)]. Extensions The color between the new background image and the image of the subject were mixed (weighing the image of the subject more than the new background). This resulted in a transparent image of the subject. Also, feathering was attempted at the edges of the subject. For every pixel at an edge, each of its colors was set to an average of its value and the values of the eight surrounding pixels for that color. No drastic improvement could be observed, probably due to the fact that the erroneous layer around the edge was ticker than one pixel. Some subtle improvement was noticed however (compare Figs 8 and 2)
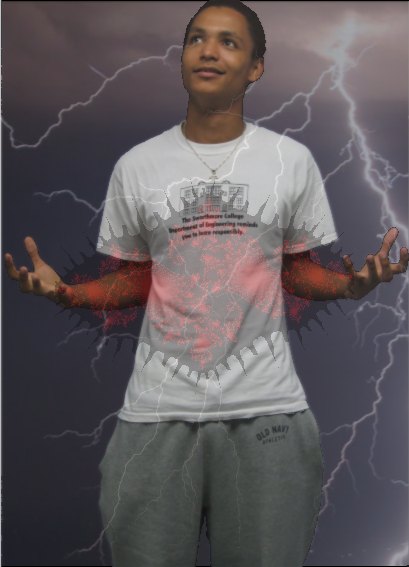
Watermarking the image of the subject with the new background was performed by overlaying a picture of the Julia set with the said image. This can be seen in Fig 9 below.
|
||
© Paul Azunre, 2006 |
.png)